Australia switches on gas during COVID winter
Gas is a diverse fuel providing many benefits across the economy. It contributes about 26 per cent of domestic energy consumption and provides Australia’s third-biggest export income.
Daily energy consumption
Energy consumption charts are generally presented for electricity and focussed on the National Electricity Market.
Representations of total energy consumption should include the use of gas and transport fuels to paint a complete picture of how energy is used in Australia.
The following charts are based on data from the Australian Energy Market Operator (AEMO), the Australian Energy Statistics and the Australian Petroleum Statistics reports. LNG exports and the use of transport fuels for aviation and shipping are excluded.
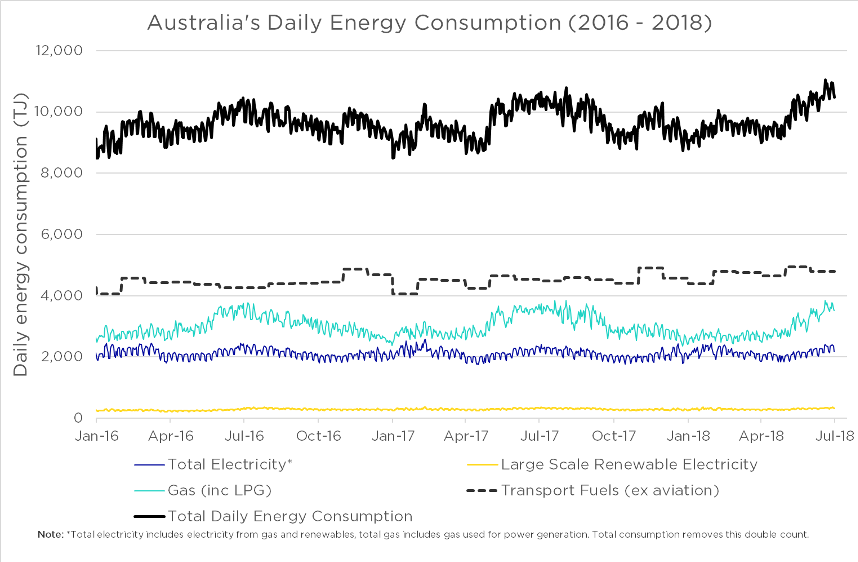
Figure 1: Australia’s daily energy consumption 2016-18.
The total energy consumption, shown by the solid black line of the chart, shows a seasonal trend during winter that reflect the seasonal use of natural gas.
Of the three sectors, transport fuels provide 49 per cent of the total energy consumption, gas 32 per cent (including LPG use across the country) and electricity 19 per cent. There is an overlap between gas and electricity as gas is used to generate electricity. This is explored in the individual break down by state.
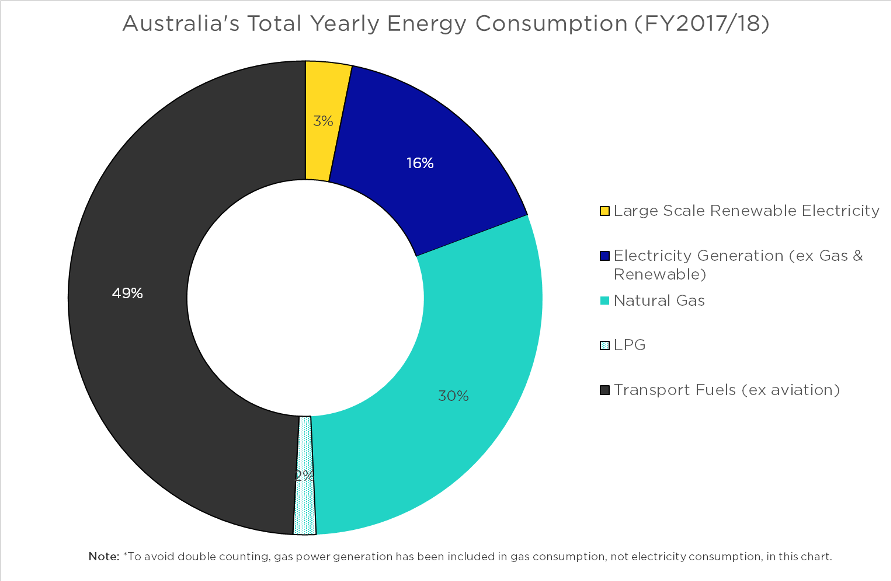
Figure 2: Annual energy consumption fro 2017/18.
Renewables are growing but only represented 3 per cent of total energy consumption in 2017/18. Renewable generation has grown from 17,955 GWh in 2000 – mainly from hydro – to 44,643 GWh in 2017/18 – mainly from wind and a similar amount of hydro as in 1999/2000.
This growth in renewable generation has been supported by government programs such as the Renewable Energy Target and feed-in tariffs.
Renewable electricity is continuing to grow and will continue to replace fossil-fueled power generation. It could also contribute to reducing emissions from transport and gas through electric vehicles and hydrogen production.
Main roles of gas
Gas contributes to many parts of the national economy, including to provide energy to households and businesses, electricity generation, feedstock to industrial processes and for exports.
The leading roles differ by region, but the table below demonstrates that gas is essential in every jurisdiction in the country.
In 2019/20, LNG exports were Australia’s third-largest export following coal and iron ore.
| State | Residential | Commercial | Industrial | Power Gen | Exports |
|---|---|---|---|---|---|
| ACT | +++ | ++ | + | NA | NA |
| NSW | ++ | +++ | +++ | + | NA |
| NT | NA | + | ++ | +++ | +++ |
| QLD | + | ++ | +++ | + | +++ |
| SA | +++ | +++ | ++ | +++ | NA |
| TAS | + | + | +++ | ++ | NA |
| VIC | +++ | +++ | ++ | + | NA |
| WA | ++ | +++ | +++ | +++ | +++ |
Table 1: Contribution of gas by jurisdiction (Key: +++ = essential contribution; ++ = major contribution; + = minor contribution)
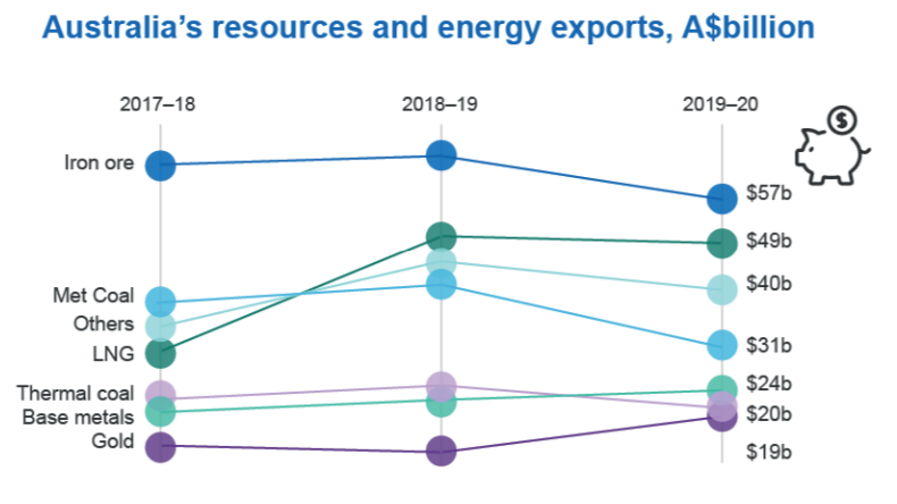
Figure 3: Australian export values by industry (Source: Department of Industry, Innovation and Science, Resources and Energy Quarterly, December 2018).
Energy consumption by states
The energy consumption for 2017/18 for each state and territory is shown below.
Australian Capital Territory (ACT)
The transport data for the ACT is not separately reported, so it has been assumed to be a subset of NSW.
The domestic electricity generation in the ACT is very low, and most of the electricity is provided through interconnectors.
The ACT does have a few local renewable electricity generators, including solar farms and landfill gas operators.
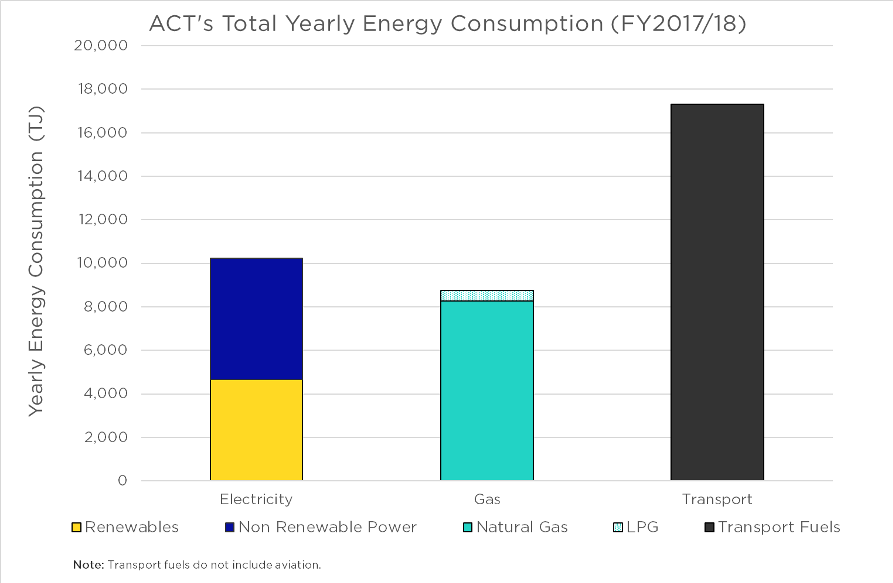
Figure 4: ACT’s energy consumption 2017-18.
- Half of the power generation is from renewables and half from non-renewables from the National Electricity Market (NEM). It should be noted that while the ACT achieved 100 per cent renewable power generation in late 2019[i], most of this was generated elsewhere in the grid. What it actually means is that the ACT is incentivising renewable electricity generation in the grid that is capable of providing enough capacity to match its entire annual demand.
- Landfill gas is used in the ACT for power generation, supported by the Renewable Energy Target.
- Energy consumption in the ACT is very seasonal due to its cold winters and hot summers. The peak demand for gas in July is seven times the demand for gas during summer.
New South Wales
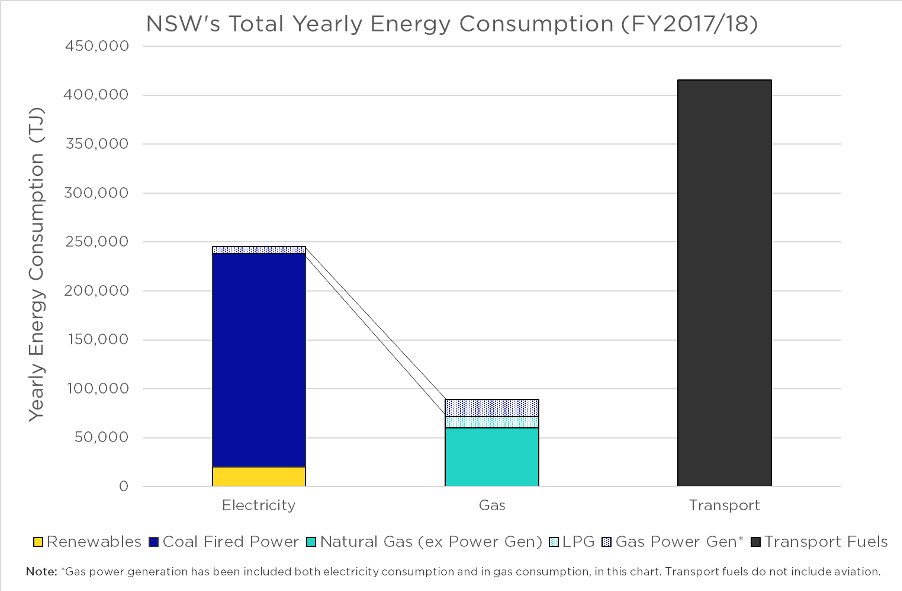
Figure 5: NSW energy consumption 2017-18.
- NSW has a large coal fleet that produces most of its electricity. A small amount of gas is used for power generation.
- Gas is used across the state for residential and commercial consumers and industrial users.
- NSW has two electricity peaks during the year, one in summer and one in winter. Gas demand also peaks in winter due to the increase in heating load.
- The total amount of transport energy is more than electricity and gas combined.
Northern Territory (NT)
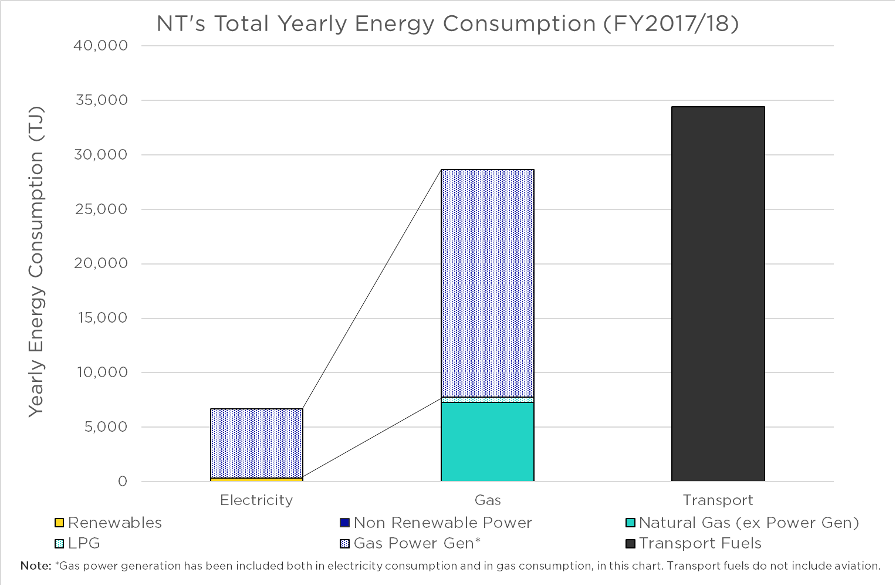
Figure 6: Northern Territory energy consumption 2017-18.
- Gas is a significant supplier of energy in the NT, and almost all of its electricity is produced from gas.
- The other gas is used by some industrial customers.
- NT also has significant LNG export projects.
Queensland
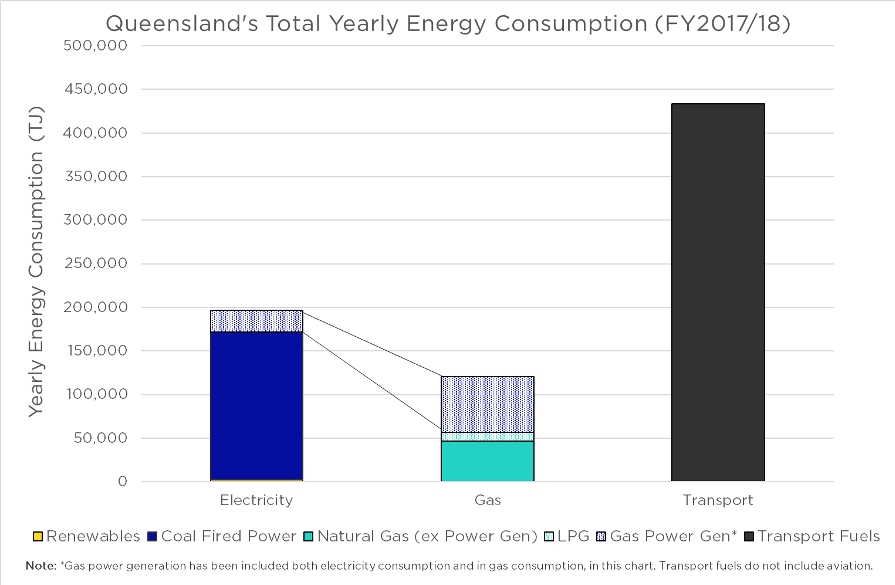
Figure 7: Queensland’s energy consumption 2017-18.
- Queensland has a broad base of coal-fired power stations, and about 10 per cent of its electricity is produced by gas.
- Queensland has a small seasonal summer peak for electricity consumption, but the gas consumption profile across the year is relatively uniform.
- Gas exports from the three LNG plants in Gladstone are not shown but represent almost 2.5 times the total gas consumption on the east coast of Australia.
South Australia (SA)
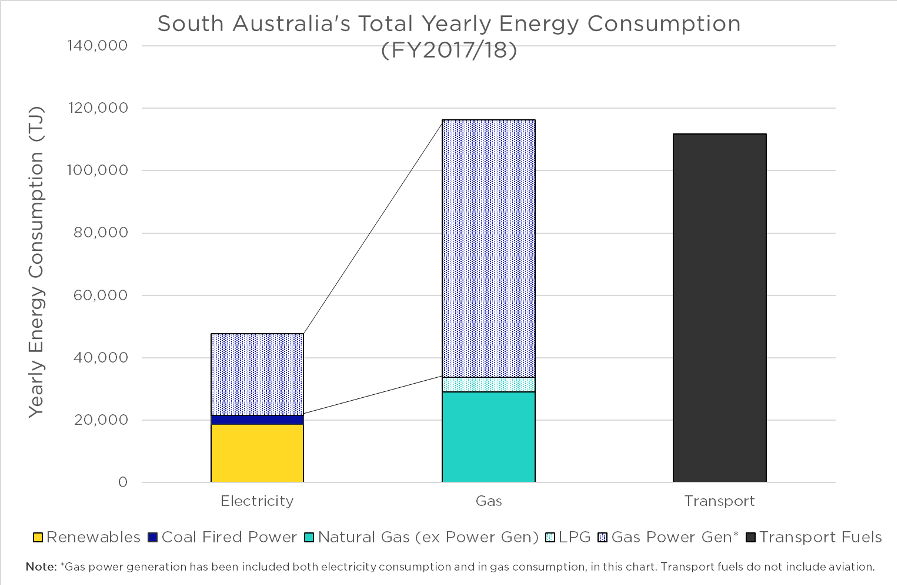
Figure 8: South Australia’s energy consumption 2017/18.
- Electricity generation in SA is almost half from gas and half from renewables. The coal-fired power shown in Figure 8 has since been closed down and replaced by more renewables and gas.
- There is a considerable variation of gas load on a daily basis to support the high level of variable renewable generation. There is also a slight increase in peak during winter due to increased heat requirements.
- Gas provides the largest amount of energy to the state.
Tasmania
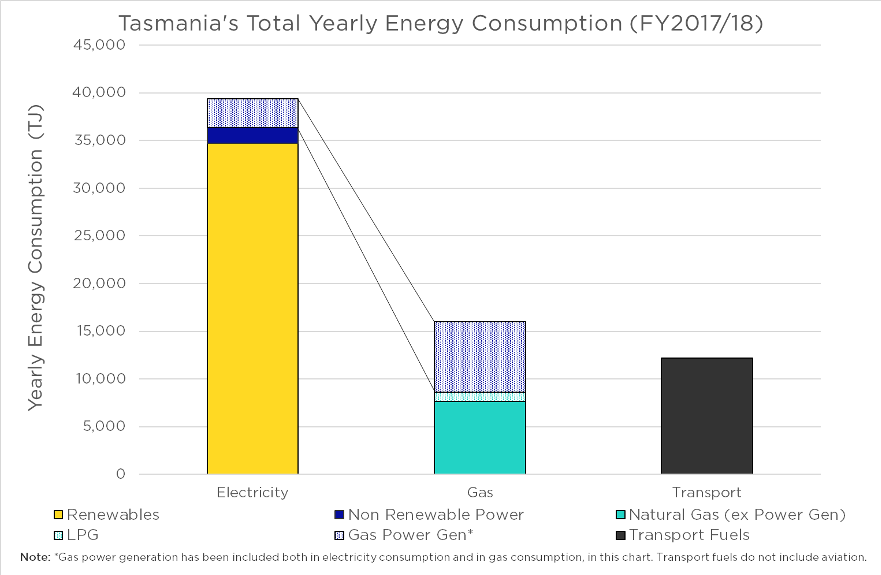
Figure 9: Tasmania’s energy consumption 2017/18.
- Generation in Tasmania is mostly from renewables, and this is supported by gas and other fossil fuels.
- Gas consumption for large industrials constitutes almost 80 per cent of Tasmania’s gas demand.
Victoria
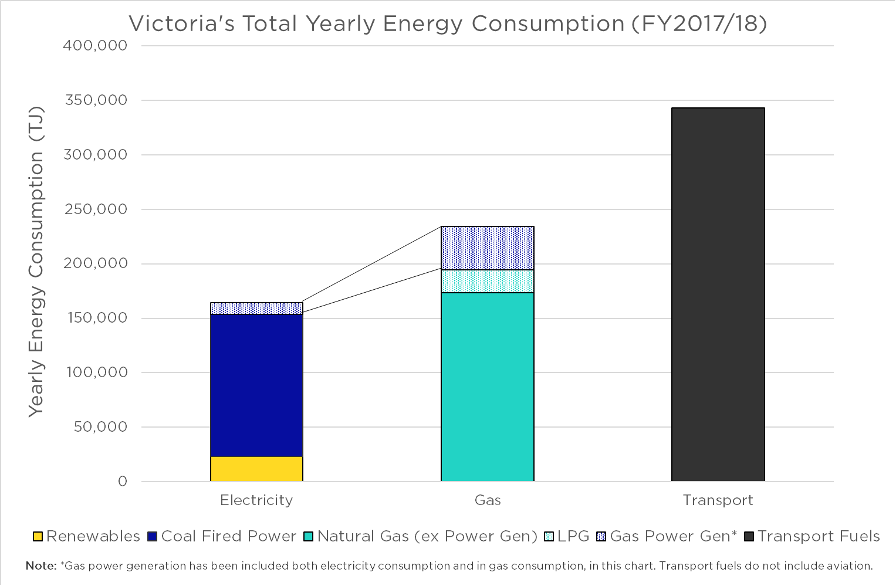
Figure 10: Victoria’s energy consumption 2017-18.
- Victoria has the highest number of residential and commercial connections at more than 2 million, which is almost 40 per cent of the total connections across the country. These customers consume 56 per cent of the gas in Vicotria.
- Victoria is still predominantly coal-fired for power generation, although that is changing with the government’s approach to increase its renewable power generation by 2025.
- Gas consumption is very seasonal with more than twice the gas consumed during winter months compared to summer months.
Western Australia (WA)
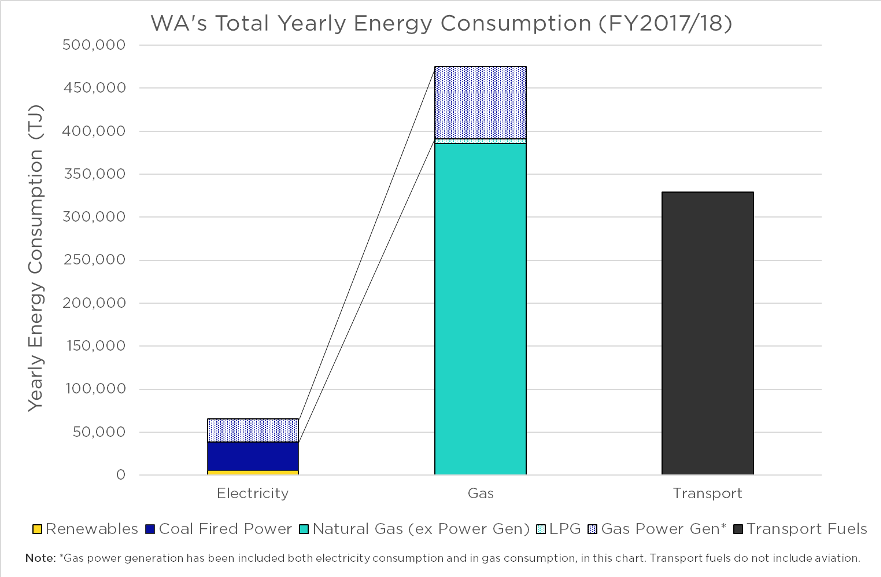
Figure 11: Western Australia’s energy consumption 2017-18.
- Gas consumption in WA represents more than 40 per cent of the total domestic gas consumption in Australia.
- Electricity is mainly provided by gas and coal power plants.
- Gas consumption is uniform throughout the year as the majority of gas is used in mining and industrial processes. LNG exports from WA account for 57 per cent of Australia’s gas exports[ii].
Gas’ diverse role
Gas is much more than just a fuel that we use for cooking.
Within homes, it is also essential to provide space heating and hot water. More broadly, in the economy, it has diverse roles such as supporting businesses or being used by industry as both an energy source and a chemical feedstock (e.g. in fertiliser manufacturing).
Gas also supports the renewable electricity generation and through its flexibility is allowing higher levels of renewables to be reached.
Finally, gas provides an enormous economic benefit to Australians through LNG export projects from the North of the country.
[i] https://www.abc.net.au/news/2019-10-01/act-is-100-per-cent-renewable-but-what-does-that-mean/11560356
[ii] WA nameplate capacity of 49.8 Mtpa out of a total national capacity of 83.4 Mtpa

