Commercial down v residential up: COVID-19’s electricity impact
It’s been a month since Australia ramped up efforts to halt the domestic spread of COVID-19 and “paused” business as usual. In this time, people and businesses have needed to refocus on essential services and tasks.
A downturn and change in the economy will inevitably have impacts on the energy system. In our last article, we were curious to see if there would be a significant reduction in Australian demand, similar to international experience. For example, since lockdown measures were introduced in the USA, utilities there have seen energy demand reductions of between 5 per cent and 15 per cent[i].
National impacts
In March, there were clear reductions in operational demand in the National Electricity Market (NEM).
Overall, demand was down 6.7 per cent, with South Australia experiencing the biggest reduction of 11.1 per cent and a new record low[ii].
While the Australian Energy Market Operator (AEMO) has seen wholesale price reductions[iii], there have been no concerns about system strength.
Given we are entering Autumn, continuing changes in demand may also reflect expected reductions due to seasonal variations[iv].
The NEM may also be now following AEMO’s slow change scenario. This scenario reflects a general slow-down of the energy transition, which assumes weaker population and economic growth, and low political, commercial, and consumer motivation to make the upfront investments required for significant emissions reduction[v]. However, the scenario also envisages slower technology advancements and technology costs reductions, which there is no evidence to support, to date.
It will be important to continue to monitor the effects of COVID-19 on the NEM in the following months.
Deep dive into Victoria’s weekly demand
Smart meter data from Victoria allows us to take a deeper look at demand patterns.
In Jemena’s network, total consumption has remained relatively flat when comparing the last week of March across 2020 and 2019[vi].
| Jemena is the Distribution Network Service Provider (DNSP) for north-western Melbourne, providing electricity to over 350,000 homes and businesses[vii]. The service area includes Tullamarine airport. |
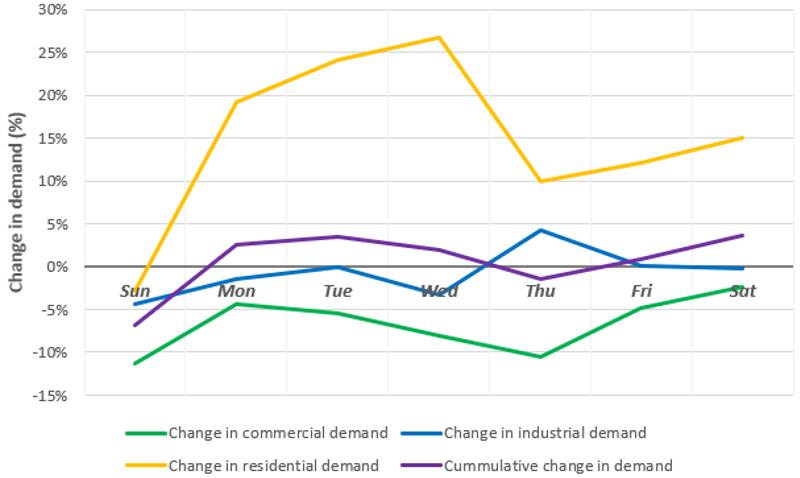
Using Jemena’s smart meter data, we compared the demand recorded between 1-7 March 2020 (pre-lockdown) and 22-28 March (post-lockdown). These weeks had very similar weather characteristics, which allowed us to make a better comparison of how weekly residential, industrial and commercial business demand has changed.
Comparing the two weeks showed a:
- Decrease in commercial demand (which typically accounts for the highest usage) by seven per cent;
- Decrease in industrial demand by one per cent and;
- Increase in residential demand by 14 per cent.
Overall demand for the week in lockdown increased by one per cent.
We are also able to look at how demand has changed each day. Figure 1, below, shows the daily change in demand for each sector. From this graph, it can be seen that residential demand has changed significantly, with a new mid-week peak. The graph also shows fluctuations in commercial and industrial demand, with deviations around Thursday.

Figure 1: Change in daily demand for March 2020
Considering daily demand in Victoria
Diving further into how demand is changing in Victoria, we have been able to use data from AusNet Services. This data shows an average day in the last week of March 2020 and in March 2019.
| AusNet is the distribution network service provider for all of eastern and northeastern Victoria, providing electricity to more than 740,000 customers. The service area includes Gippsland, the Yarra Valley and Melbourne’s outer east[viii]. |
An analysis of this data showed a:
- Decrease in large business[ix] demand by five per cent;
- Decrease in small-medium enterprises (SME)8 demand by 12 per cent and;
- Increase in residential demand by five per cent.
Overall, total daily demand decreased by two per cent.
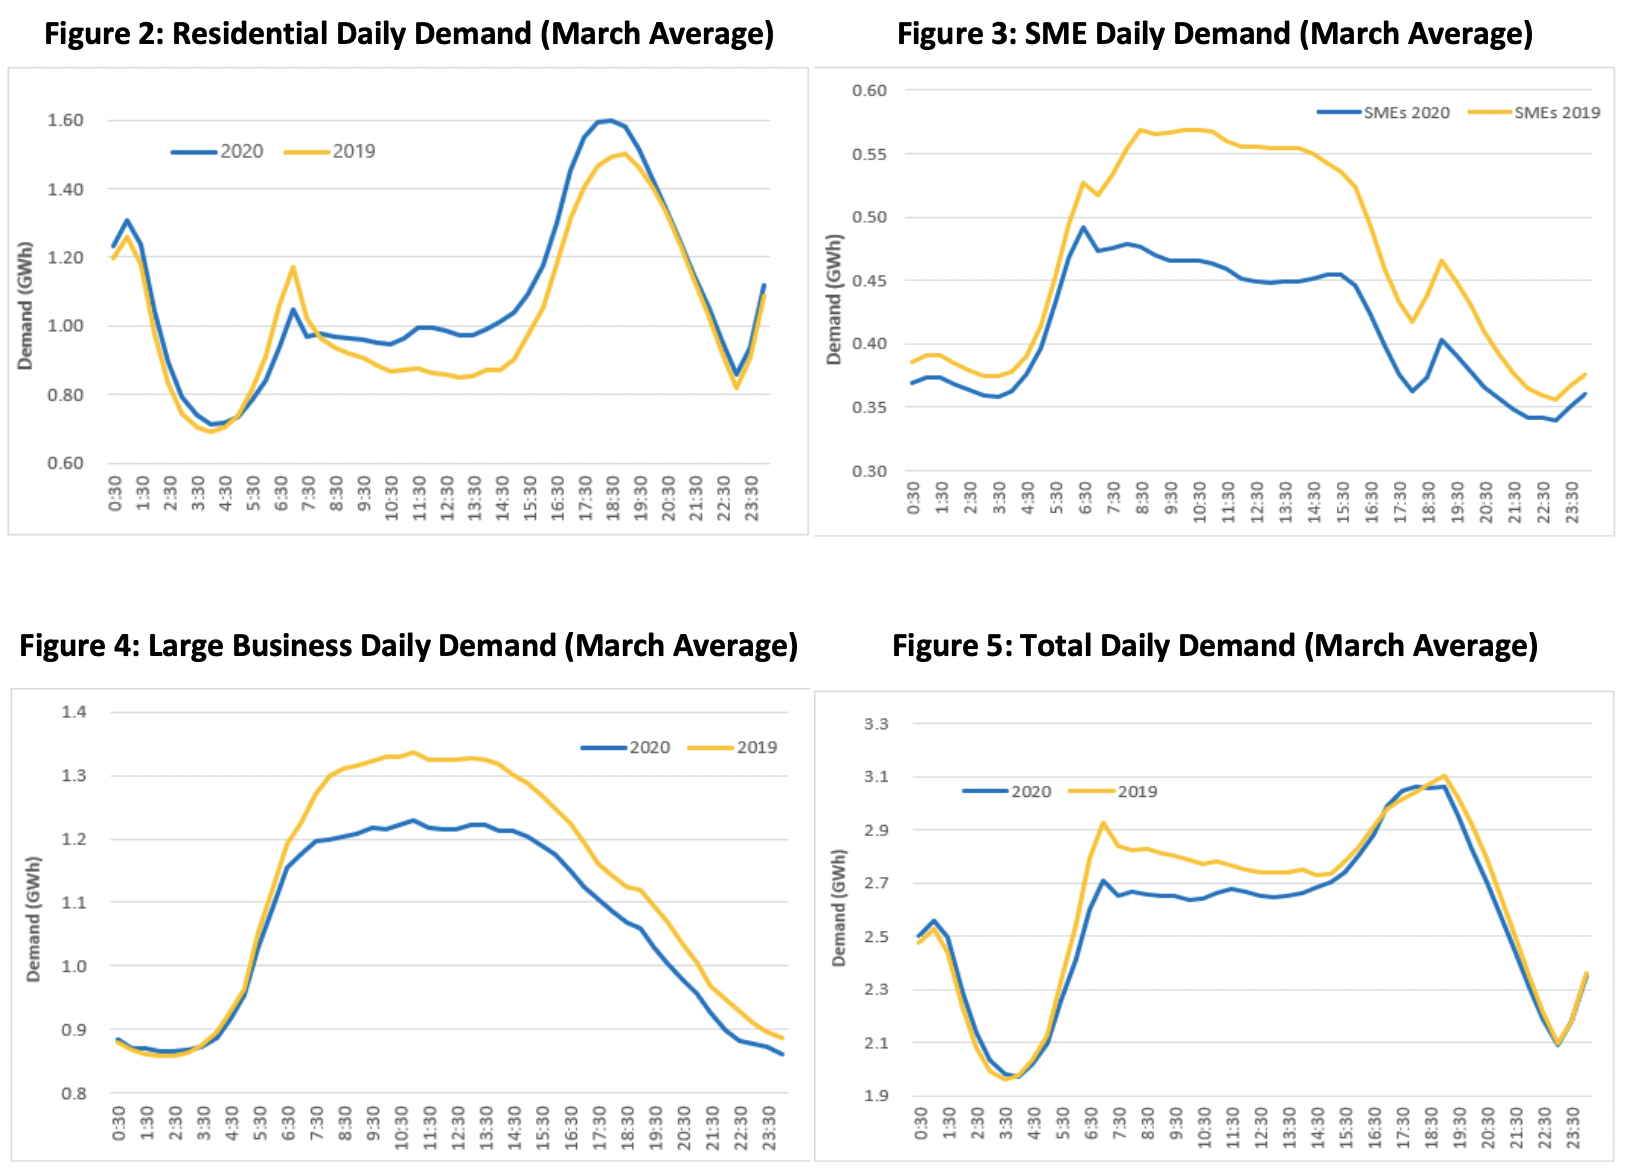
The series of graphs below shows the daily change in demand for each sector.
For residential customers, Figure 2 shows that the morning peak has shifted, more energy is used throughout the day, and there is a larger evening peak. For small to medium enterprises (SMEs) and large businesses (Figures 3 and 4), the usage pattern has not changed, but there is a significant reduction in demand during the day. The overall impact (Figure 5) is a reduced morning peak.

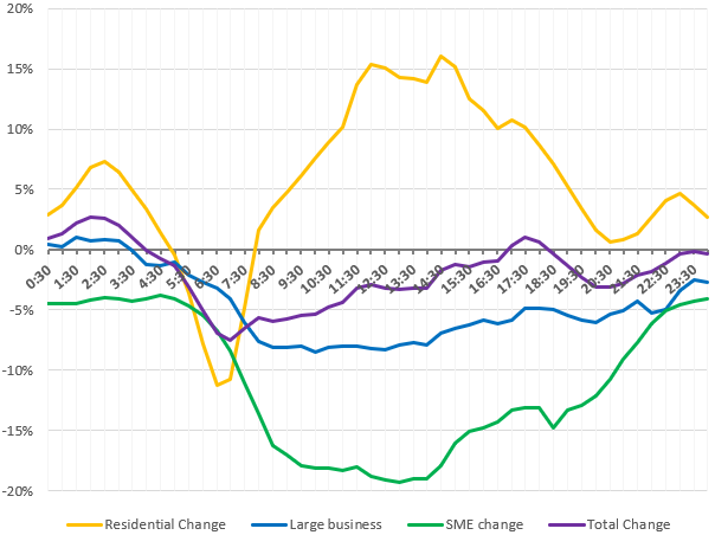
By also considering the daily percentage change in demand, Figure 6 shows the dramatic change in energy by each sector in March 2020. It also highlights the large drop in business by SMEs in AusNet’s region. This reduction outweighs the increases in the residential sector. The overnight minimum demand has seen the least change.

Figure 6: Daily Demand Change (%) March 2020 vs March 2019
Outlook
It is encouraging to see that, so far, overall demand has not dropped as significantly as in some other countries and there have been no significant network security issues relating to the COVID-19 pandemic to date. However, the impacts of the pandemic on individual sectors are dramatic, and it will be important to monitor the situation.
Hopefully, we are now seeing the worst impacts and energy demand will soon start to re-stabilise as it has internationally. It is also hoped that government relief packages will help stabilise the economy.
Networks are contributing to the pandemic response by offering support to customers and are committed to the AER Statement of Expectations[x]. A guide to what “$1 of electricity gets me”[xi] may be useful if you are interested in knowing how energy is used at home.
[i] Walton, R. (2020, April 9). Clearer picture of coronavirus-driven grid load declines emerges in US after weeks of lockdowns. Retrieved from Utility Dive: utilitydive.com/news/clearer-picture-of-coronavirus-driven-grid-load-declines-emerges-in-us-afte/575777
[ii] Macdonald-Smith, A. (2020, April 6). Suppliers Power Up. Australian Financial Review, p. 36 (https://www.energycouncil.com.au/media/18196/suppliers-ok-afr.pdf)
[iii] Macdonald-Smith, A. (2020, April 6). Suppliers Power Up. Australian Financial Review, p. 36 (https://www.energycouncil.com.au/media/18196/suppliers-ok-afr.pdf)
[iv] Adisa, L. (2020, April 9). COVID-19 and the NEM: are ducks immune to the pandemic? Retrieved from Cornwall Insights Australia: cornwall-insight.com.au/covid-19-and-the-nem-are-ducks-immune-to-the-pandemic/
[v] AEMO. (2019). 2019 forecasting and planning scenarios, inputs and assumptions. Australian Energy Market Operator Limited
[vi] Pintabona, M. (2020, April 14). LinkedIn. Retrieved from linkedin.com/in/michaelrpintabona/
[vii] Electricity. (2020). Retrieved from Jemena: jemena.com.au/electricity
[viii] Who We Are. (2020). Retrieved from AusNet Services: ausnetservices.com.au/Misc-Pages/Links/About-Us/Who-we-are
[ix] Large businesses use over 160MWh per year, while SMEs use less than 160MWh per year
[x] energynetworks.com.au/about/our-members/covid-19-information/
[xi] energynetworks.com.au/news/media-releases/2020-media-releases/1-of-electricity-gets-me/


