Network scorecard highlights lower costs and higher reliability
The Australian Energy Regulator publishes an annual Network Performance Report (NPR) to assess the operational and financial performance of network service providers (NSPs) across the National Energy Market (NEM). This year, the NPR combines reporting of electricity and gas to allow for side-by-side comparison of these energy sources. The report reveals networks are continuing to provide better outcomes for its customers. Normalised outages are occurring less frequently and for a shorter amount of time at the same time as network charges decline.
Revenue per customer declines
Consumers’ electricity bills include several components, including network costs, wholesale market costs, retail margins and jurisdictional costs. The latest 2023 data, as shown in figure 1, shows customers are on average paying less in real terms for the network component of their energy bills.
As shown in figure 1, overall network revenue in real terms for 2023 was at its lowest since 2009 and declined 2.9% from 2022. In 2023, electricity network revenue per customer reached its lowest since the start of the data set in 2006 for both distribution and transmission NSPs.
Figure 1: Total network revenue recovered from consumers – Electricity distribution and transmission NSPs – $ real 2023
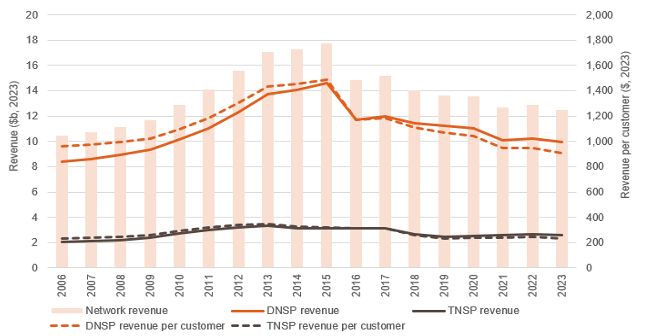
Source: AER 2024 Electricity and Gas Networks Performance Report
Revenue per customer in real terms is different from the actual network costs customers pay. Nominal revenue per customer increased in 2023 but remains below the peak in 2015. The increase in 2023 network revenue per customer in nominal terms is less than the increase in inflation. Meaning if it were not for high inflation, nominal revenue per customer would have fallen in 2023.
Electricity distribution networks can recover the payments for jurisdictional scheme obligations. The total amount of jurisdictional payments varies between states. In 2023 such payments represent 5.5% of total network revenue.
A similar downward trend for revenue per customer is seen in gas distribution NSPs. As shown in Figure 2, network revenue recovered and revenue per customer in 2023 was the lowest in the dataset starting in 2011. In 2023, network revenue per customer declined 9.4% compared to 2022.
Figure 2: Total network revenue recovered from consumers – Gas distribution NSPs – $ real 2023
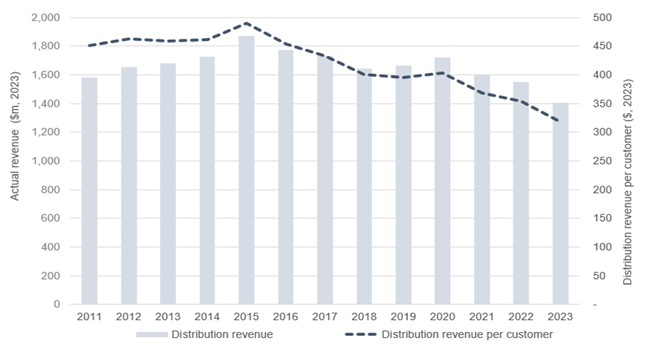
Source: AER 2024 Electricity and Gas Networks Performance Report
Networks continue to deliver high reliability
The AER measures reliability through frequency and duration of interruptions to customer supply.
As shown in figure 3, in 2023, customers experienced the fewest electricity distribution outages since the beginning of the dataset. The average duration of electricity distribution outages also decreased. Overall, the average customer in the NEM experienced 0.9 outages for a duration of 113 minutes.
Figure 3: Frequency of electricity distribution outages
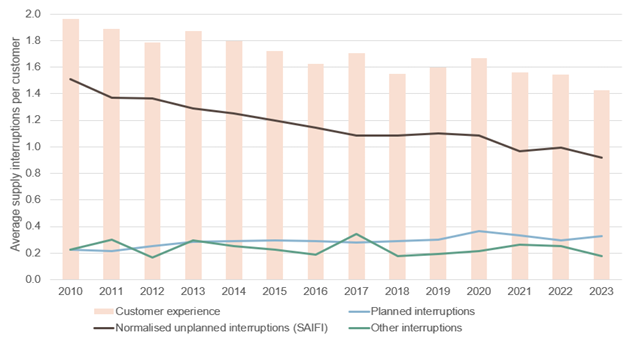
Source: AER 2024 Electricity and Gas Networks Performance Report
On average, in 2023, there was less than 0.01 gas network outages per customer. Gas network outages are inherently infrequent. Gas pipes are mostly underground and are not susceptible to adverse weather conditions. Planned outages are also infrequent as works can occur without interruption to supply.
Incentive scheme driving efficiencies
Overall revenue earnt from incentive schemes for electricity NSPs in 2023 was the highest earnt since the AER implemented the scheme. This is largely from more electricity NSPs becoming eligible for the capital expenditure sharing scheme (CESS). The CESS rewards NSPs for spending up to 30% less than the approved capital expenditure, allowing NSPs to share the unspent capital allowance with customers at the end of the regulatory period. 70% of the revealed efficiencies are returned to customers through lower network charges in following regulatory determination periods.
The way the regulatory framework is set up means incentive scheme do not always deliver financial benefits for NSPs. In 2023, gas DNSPs incurred $2m of payments, decreasing $7m from the previous year. The scheme targets efficiency gains and reducing costs from capex and opex. In comparison to electricity NSPs, gas DNSPs typically earn minimal revenue from incentive schemes.
Looking ahead
The AER is expected to continue publishing a joint annual electricity and gas networks performance report. Comparing the two energy sources can provide valuable insight through the energy transition journey.
The results discussed indicate networks remains the most stable component of the energy supply chain. Customer outcomes continue to be put at the forefront of NSPs strategic direction as showcased from the ability to achieve fewer and shorter outages at lower costs for customers. These outcomes are achieved through an ever-changing environment and the challenges of the transition to reach net zero.


