The Time is Now: a customer centric modelling approach
Our recent report, The Time is Now: Getting smarter with the Grid, highlights that the distribution grid could do more of the heavy lifting in the energy transition. It recommends unlocking more of what we already have (e.g. capacity to host solar and to use the system more effectively) and designing a grid with more of what we need for the future (e.g. with more batteries in the best spots to soak up solar and infrastructure supporting a smooth transition to EVs).
More detail on the recommendations and implications of the report can be found here.
So, you’ve done some modelling…
We’ve done this wonderful modelling… “Great”, you say, with a hint of sarcasm.
You’d be 100 per cent justified in being sceptical. Modelling should never be taken at face value. After all, a model is just inputs, mathematics, and outputs. Understanding how the modelled world works is the only way to interpret how its outputs relate to the decisions we could take in the real world.
No model should hold itself out as predicting the future. It will always be a crude and necessary simplification of the real world – balancing accuracy with cost and time, while being blissfully unaware of unforeseeable events just around the corner (think war in Ukraine).
Scenario modelling is a good way to test the value of different options
Choosing the right modelling approach to meet the objectives of the work is critical. In this case our objective was to answer the question “how can we enable the energy transition faster and at lower cost for customers by distribution networks playing their optimal role in the energy system?”
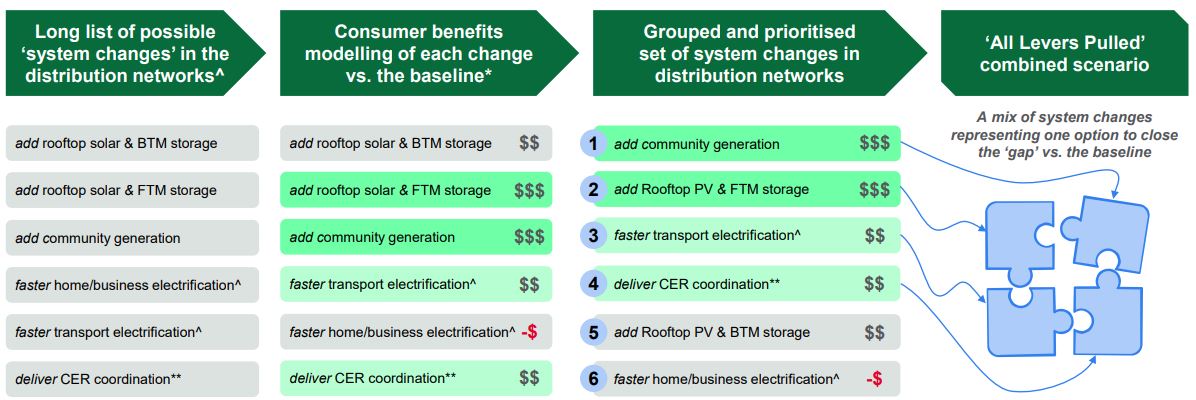
We chose a scenario modelling approach because this is the best way to test the value of what we could do and build a picture of what we should do. In this case, we sought to test the value of a set of possible actions or ‘system changes’ in the distribution system. The process involved:
- building a ‘baseline’ scenario, that is a recognisable and reasonable (if not perfect) view of the future
- seeing what happens to the model outputs if we take certain ‘actions’ within the distribution system (i.e. change some of the inputs to the model), and
- building a separate ‘all levers pulled’ scenario that combines those actions that have the greatest value to customers.
The figure below shows the scenarios tested and process followed to build the ‘all levers pulled’ scenario.

Setting a baseline, or ‘counterfactual’, is a really important decision in the process for scenario modelling. The role of the baseline is to show the future without doing anything differently. In this case, we started with the Australian Energy Market Operator’s Integrated System Plan (ISP) step change scenario and varied it slightly:
- large-scale generation deployment was dialed back to being in line with maximum historical build (in the order of 5 GW per year), which we considered to be a reasonable forward projection of the path we are on
- transmission build remained consistent with the ISP, and
- there were no changes to CER or distribution-connected resources (including assumptions around coordination and demand profile).
The result is a baseline (which we call the ‘missed opportunities scenario’) that has less new generation in the system by 2030 than the ISP step change scenario does. This causes both higher wholesale electricity costs and higher emissions costs (because this scenario reaches around 74 per cent renewables in 2030 vs the ISP step change scenario that reaches 82 per cent).
Perspective, scope and timeframes are critical to informed decision making
The modelling approach had to show the value of various tangible changes from the baseline that could occur in the distribution system in the near term to make a material difference for customers. Key modelling decisions taken with this in mind were:
- to focus on outputs from the perspective of a household’s whole of energy spend, so that there are no costs or benefits hidden outside of the scope of the model, and
- to present outcomes in the year 2030, which is a near term yet interim goalpost to inform the question ‘what should we do now?’
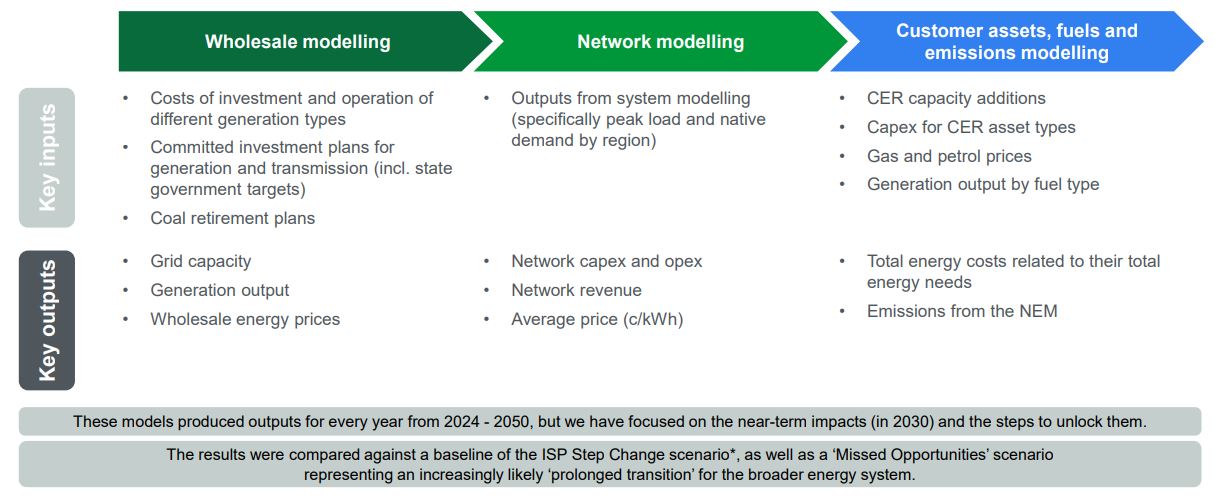
Developing outputs from the customer’s whole of energy spend perspective involved stacking multiple models, including:
- a wholesale market model, developed by Endgame Economics
- a distribution network post tax revenue model and a transmission cost model, developed by Dynamic Analysis, and
- a customer cost and emissions model, developed by L.E.K. Consulting
The figure below shows the inputs and outputs from each of these models.
![]()
While fuel costs (such as gas) were included in the customer cost model, gas network costs were not. This was a choice taken to reduce the complexity of the model while not reducing its accuracy to inform decisions for the electricity distribution system. To have included these costs would have required setting cost (including depreciation) profiles for gas networks out to 2050. This would not have materially changed outcomes in the year 2030 (the focus of outputs presented for this modelling) and nor would there have been any change in total or customer costs between the baseline and ‘all levers pulled’ scenarios, because both have the same electrification inputs.
Headline results
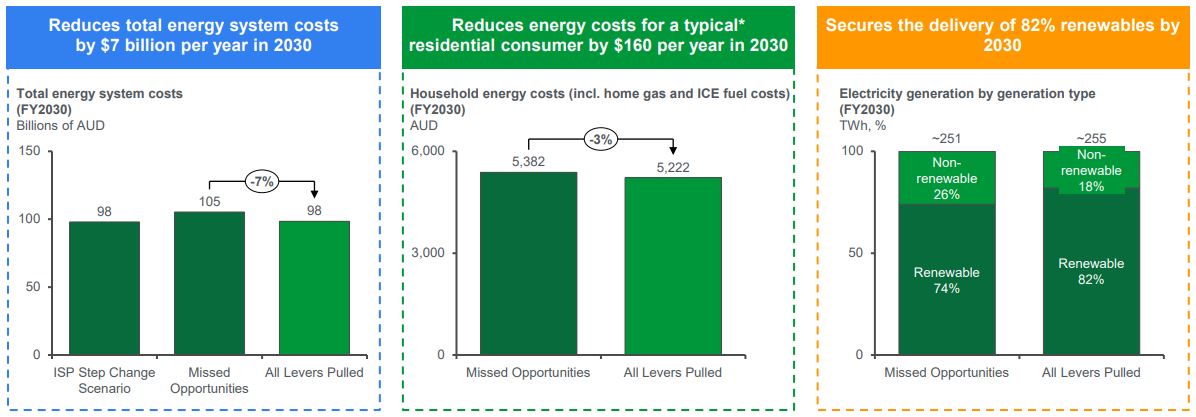
I’m sure by now you’re done with the approach and would like to see some results. The key results, shown below, are that the ‘all levers pulled’ scenario:
- reduces total system costs significantly in 2030
- reduces customer energy costs for a typical customer (i.e. a customer without CER or an EV), and
- increases the proportion of renewable energy back up to 82 per cent.
![]()
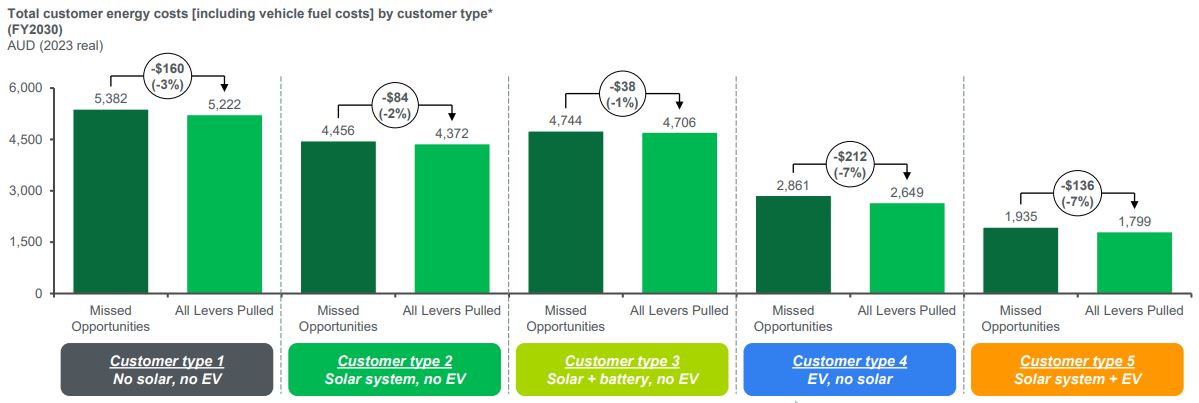
Perhaps more importantly, all customer types modelled are better off under the ‘all levers pulled’ scenario. While this is good news for customers who do not make choices to change their energy asset mix, it is better news for those who do. Customers making such choices move from left to right in the figure below, realising even greater benefits.
![]()
The value of these outputs is to start a conversation about what changes in the real world might get us closer to these results shown in the modelled world. The challenge is to build collaboration across the energy sector and its customers to help bring that world to life.
We must keep our foot to the floor when it comes to delivering large-scale renewable energy projects and connecting them into the system – that is not in question. What this modelling really shows is that we can and should do more on our local networks now, to enable better outcomes for customers in the near future.
We will continue in future articles to highlight the results and the specific actions and changes that could be made (in the real world) to help improve outcomes for customers.


